Prometheus Metric Exemplars with OpenTelemetry Tracing
The full code for this example is available on Github.
This end-to-end example shows how to instrument a Flask app with with Prometheus metrics linked to OpenTelemetry traces using exemplars. The example manually adds exemplars to a Prometheus Histogram which link the metric in Google Cloud managed service for Prometheus to Spans in Cloud Trace.
OpenTelemetry Python is configured to send traces to the OpenTelemetry Collector and the Collector scrapes the python server’s Prometheus endpoint. The Collector is configured to send metrics to Google Cloud Managed Service for Prometheus and traces to Google Cloud Trace.
digraph { rankdir="LR" nodesep=1 subgraph cluster { server [label="Flask Application"] col [label="OpenTelemetry Collector"] } gmp [label="Google Cloud Managed Service for Prometheus" shape="box"] gct [label="Google Cloud Trace" shape="box"] server->col [label="OTLP traces"] col->server [label="Scrape Prometheus"] col->gmp [label="metrics"] col->gct [label="traces"] }To run this example you first need to:
Create a Google Cloud project. You can create one here.
Set up Application Default Credentials by installing gcloud and running
gcloud auth application-default login.Have docker and docker compose installed on your machine
Attaching Prometheus Exemplars
Prometheus exemplars can be linked to OpenTelemetry spans by setting the span_id and
trace_id attributes (specification).
You can get the current span using opentelemetry.trace.get_current_span(), then format
its span and trace IDs to hexadecimal strings using opentelemetry.trace.format_span_id()
and opentelemetry.trace.format_trace_id().
def get_prom_exemplars() -> Optional[Dict[str, str]]:
    """Generates an exemplar dictionary from the current implicit OTel context if available"""
    span_context = trace.get_current_span().get_span_context()

    # Only include the exemplar if it is valid and sampled
    if span_context.is_valid and span_context.trace_flags.sampled:
        # You must set the trace_id and span_id exemplar labels like this to link OTel and
        # Prometheus. They must be formatted as hexadecimal strings.
        return {
            "trace_id": trace.format_trace_id(span_context.trace_id),
            "span_id": trace.format_span_id(span_context.span_id),
        }

    return None
Then make an observation using a Prometheus Histogram as shown below. Google Cloud Monitoring can only display exemplars attached to Histograms.
hist.labels(name="foo").observe(duration_sec, get_prom_exemplars())
Run
Checkout the example code if you don’t already have the repository cloned:
git clone https://github.com/GoogleCloudPlatform/opentelemetry-operations-python.git
cd docs/examples/prometheus_exemplars
First, set the environment variables needed to provide authentication to the Collector when it runs in docker.
export USERID=$(id -u)
export PROJECT_ID=<your-gcp-project>
export GOOGLE_APPLICATION_CREDENTIALS="${HOME}/.config/gcloud/application_default_credentials.json"
Build and start the example containers using docker-compose:
docker-compose up --build --abort-on-container-exit
This starts three containers:
The Flask server written in
server.py. It receives requests and simulates some work by waiting for a random amount of time.The OpenTelemetry Collector which receives traces from the Flask server by OTLP and scrapes Prometheus metrics from the Flask server’s
/metricsendpoint.A load generator that sends constant requests to the Flask server.
Checking Output
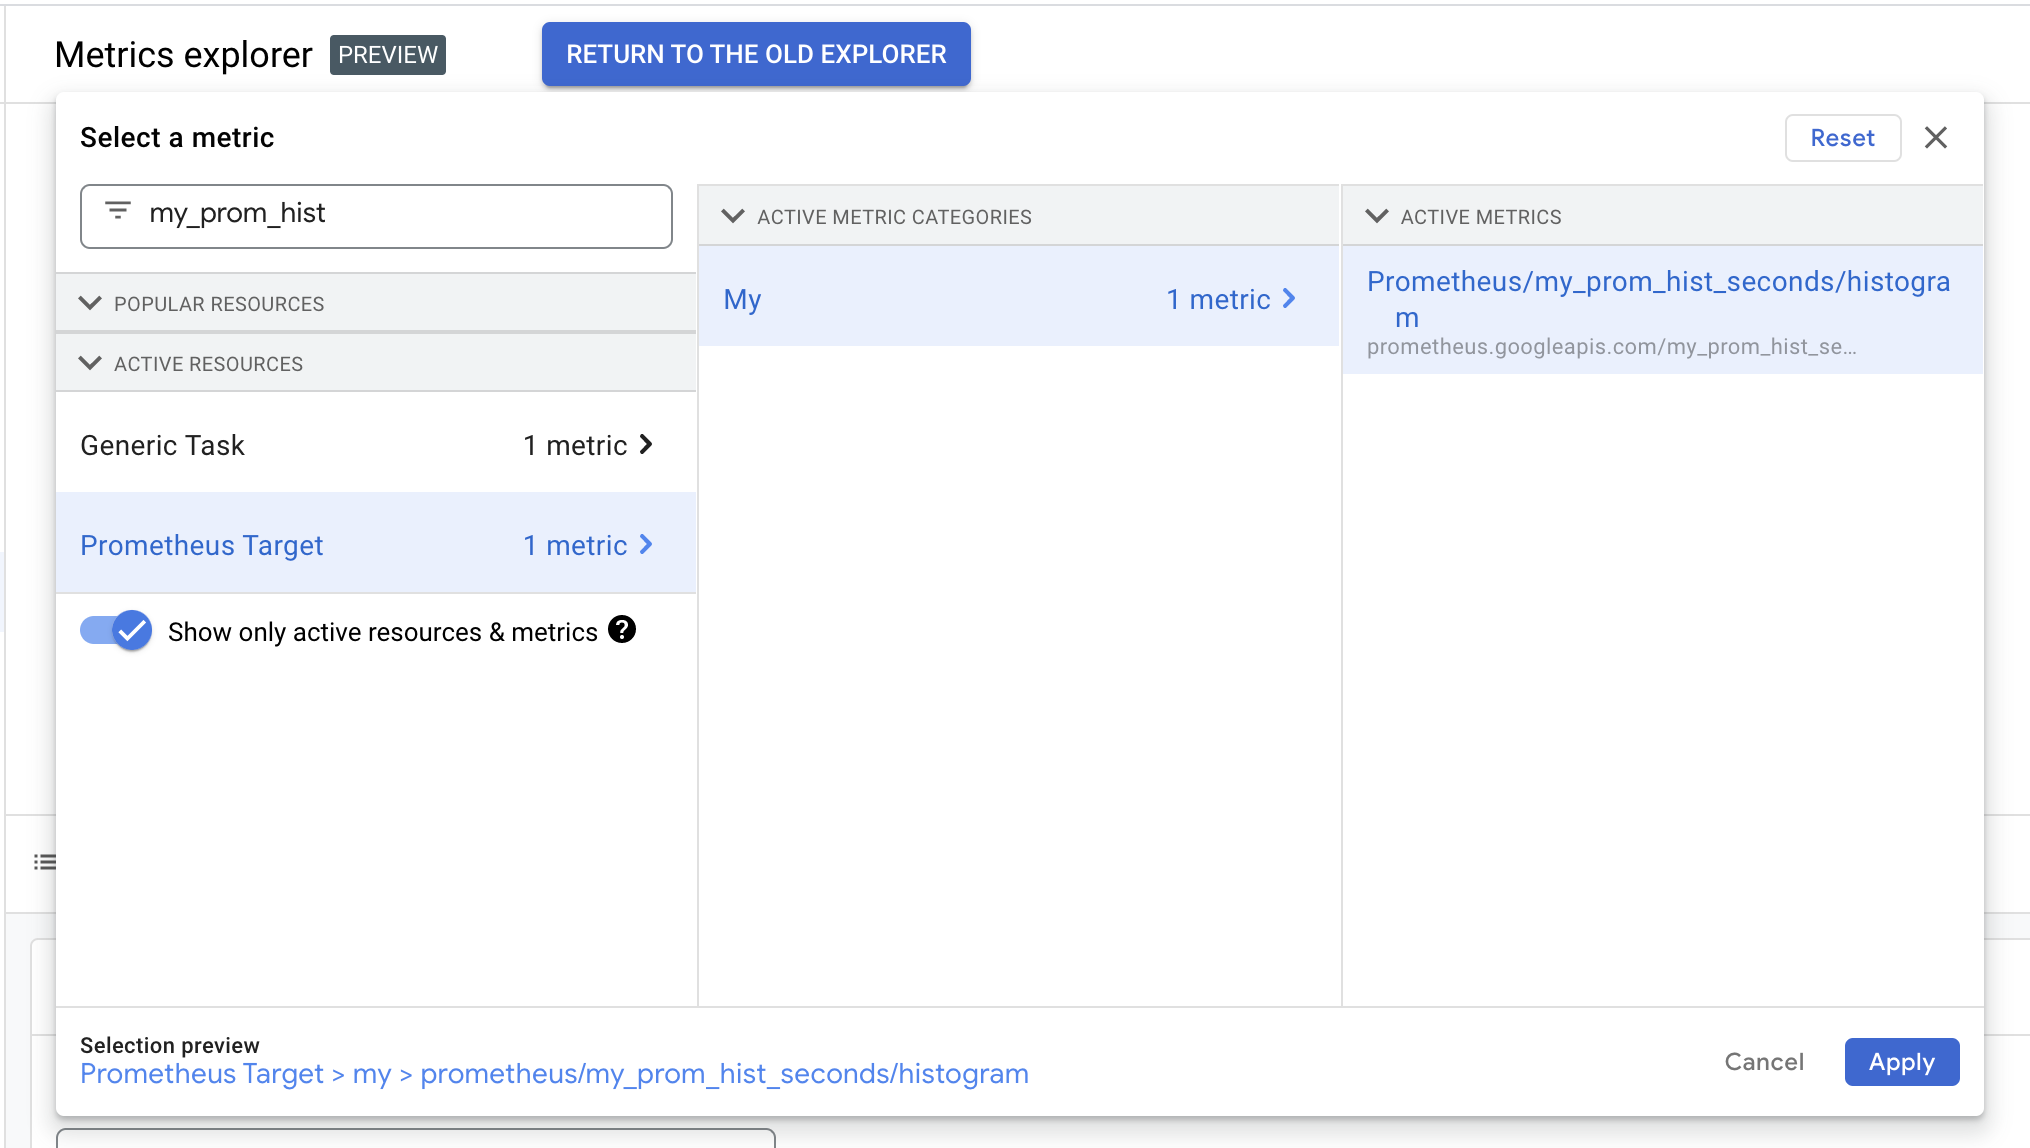
While running the example, you can go to Cloud Monitoring Metrics Explorer page to see the results. Click on
the “Metric” dropdown, type my_prom_hist, and select the metric from under “Prometheus
Target”. The full metric name is prometheus.googleapis.com/my_prom_hist_seconds/histogram.
After selecting the metric, you should see something like the image below, with a heatmap showing the distribution of request durations in the Python server.
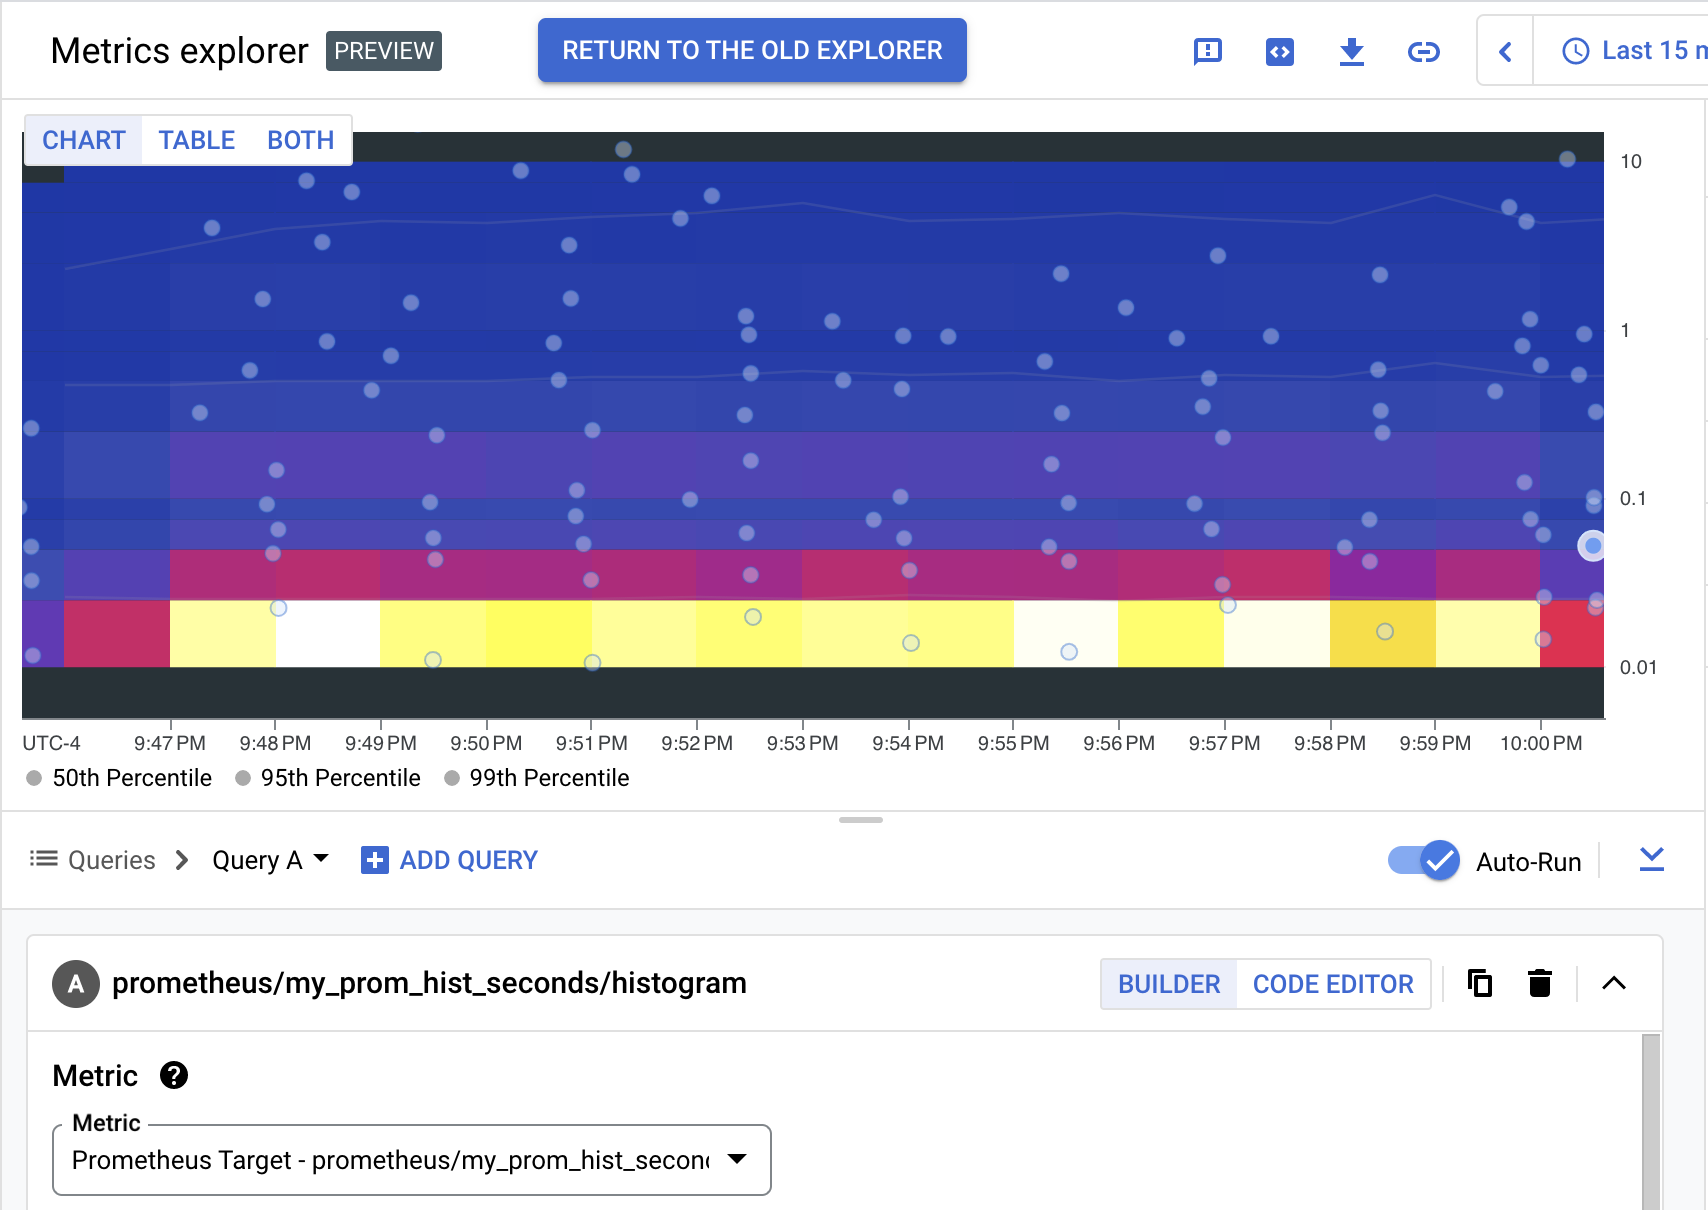
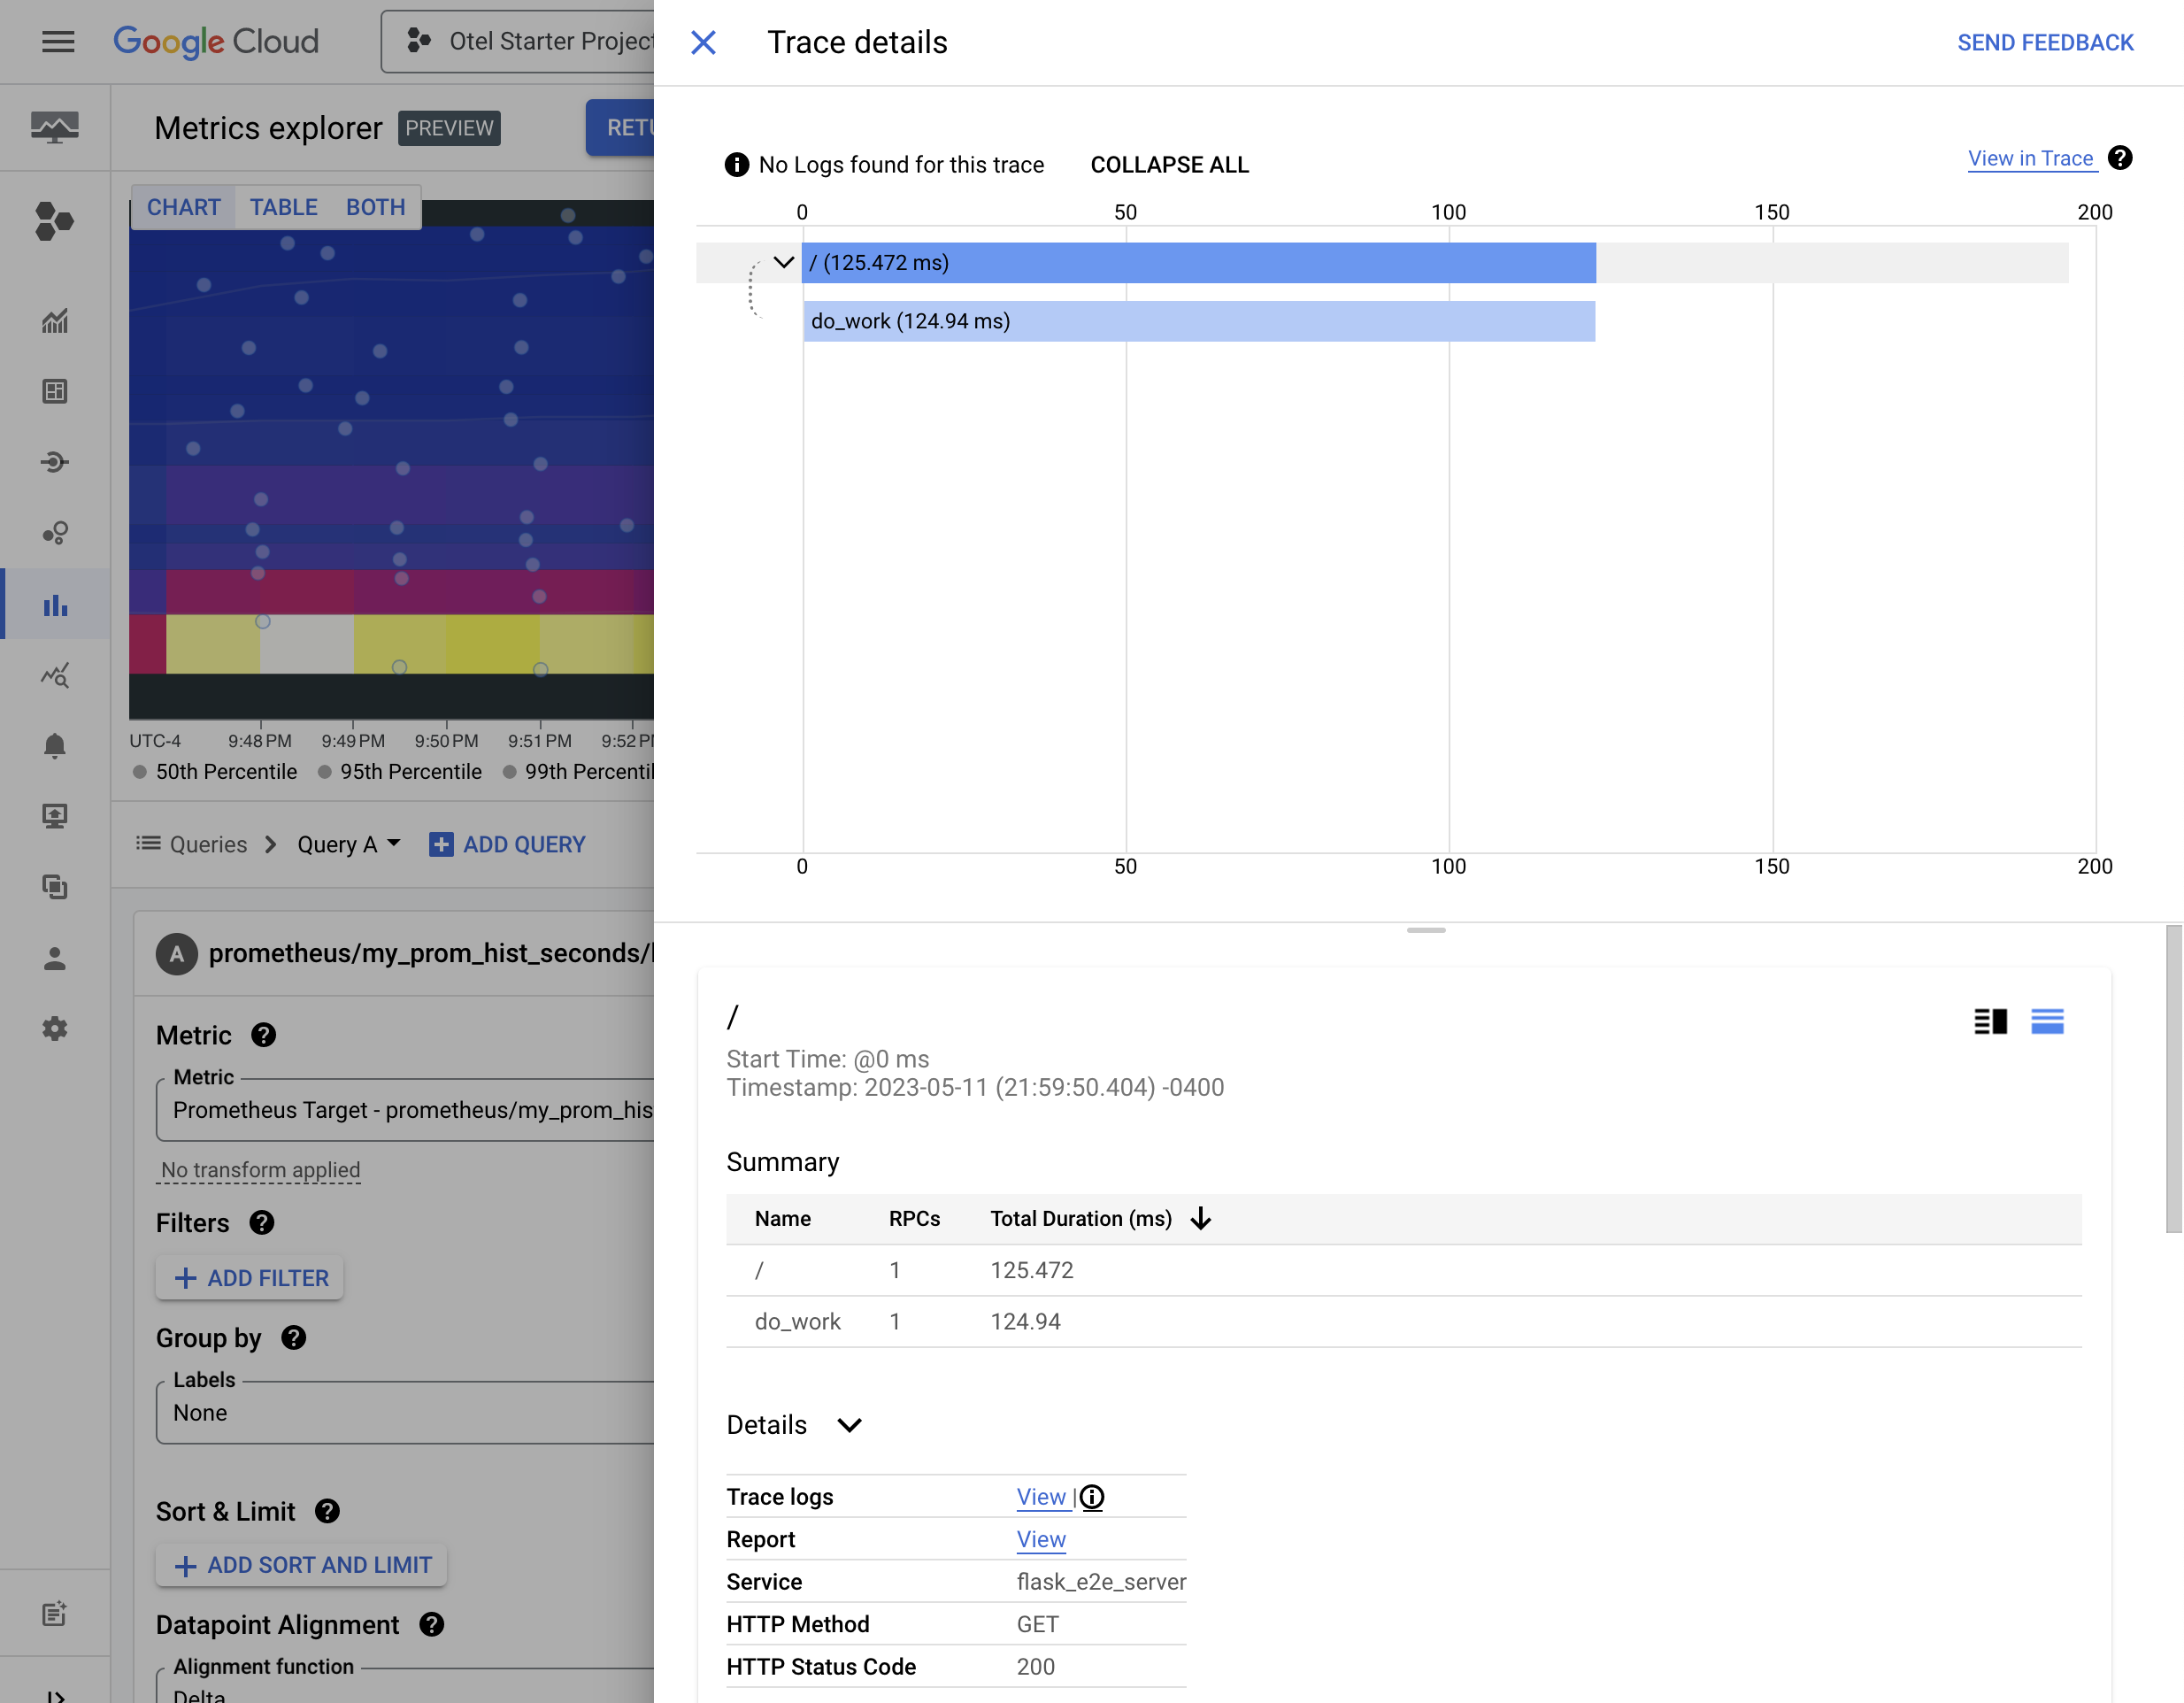
The circles on the heatmap are called “exemplars”, which each link to an example span that fell within the given bucket on the heatmap. Notice that exemplars are plotted at the time when they occurred (x axis) and duration they took (y axis) in the heatmap. Clicking on an exemplar opens the Trace details flyout focused on the linked span.