End-to-End Example with Flask
This end-to-end example shows how to instrument a Flask app with OpenTelemetry to send traces
to Cloud Trace and metrics to Cloud Monitoring. OpenTelemetry instrumentation for Flask and
requests will automatically generate spans and metrics for you. In addition, there is a client
script that uses requests to call the Flask app and propagate context with the GCP context
propagator.
To run this example you first need to:
Create a Google Cloud project. You can create one here.
Set up Application Default Credentials by installing gcloud and running
gcloud auth
application-default login
.
It is also recommended to create a fresh virtualenv for running this example:
python3 -m venv venv
source venv/bin/activate
Flask Server
Install Dependencies
pip install opentelemetry-exporter-gcp-trace \
    opentelemetry-exporter-gcp-monitoring \
    opentelemetry-propagator-gcp \
    opentelemetry-api \
    opentelemetry-sdk \
    flask \
    requests \
    opentelemetry-instrumentation-requests \
    opentelemetry-instrumentation-flask
Write the Flask Server
#!/usr/bin/env python3
# Copyright 2021 The OpenTelemetry Authors
#
# Licensed under the Apache License, Version 2.0 (the "License");
# you may not use this file except in compliance with the License.
# You may obtain a copy of the License at
#
#     http://www.apache.org/licenses/LICENSE-2.0
#
# Unless required by applicable law or agreed to in writing, software
# distributed under the License is distributed on an "AS IS" BASIS,
# WITHOUT WARRANTIES OR CONDITIONS OF ANY KIND, either express or implied.
# See the License for the specific language governing permissions and
# limitations under the License.

# [START opentelemetry_flask_import]

import time

from flask import Flask
from opentelemetry import metrics, trace
from opentelemetry.exporter.cloud_monitoring import (
    CloudMonitoringMetricsExporter,
)
from opentelemetry.exporter.cloud_trace import CloudTraceSpanExporter
from opentelemetry.instrumentation.flask import FlaskInstrumentor
from opentelemetry.propagate import set_global_textmap
from opentelemetry.propagators.cloud_trace_propagator import (
    CloudTraceFormatPropagator,
)
from opentelemetry.sdk.metrics import MeterProvider
from opentelemetry.sdk.metrics.export import PeriodicExportingMetricReader
from opentelemetry.sdk.resources import Resource
from opentelemetry.sdk.trace import TracerProvider
from opentelemetry.sdk.trace.export import BatchSpanProcessor

# [END opentelemetry_flask_import]

# [START opentelemetry_flask_setup_propagator]

set_global_textmap(CloudTraceFormatPropagator())

# [END opentelemetry_flask_setup_propagator]

# [START opentelemetry_flask_setup_exporter]

resource = Resource.create(
    {
        "service.name": "flask_e2e_server",
        "service.namespace": "examples",
        "service.instance.id": "instance123",
    }
)

tracer_provider = TracerProvider(resource=resource)
cloud_trace_exporter = CloudTraceSpanExporter()
tracer_provider.add_span_processor(
    # BatchSpanProcessor buffers spans and sends them in batches in a
    # background thread. The default parameters are sensible, but can be
    # tweaked to optimize your performance
    BatchSpanProcessor(cloud_trace_exporter)
)

meter_provider = MeterProvider(
    metric_readers=[
        PeriodicExportingMetricReader(
            CloudMonitoringMetricsExporter(), export_interval_millis=5000
        )
    ],
    resource=resource,
)

trace.set_tracer_provider(tracer_provider)
metrics.set_meter_provider(meter_provider)

tracer = trace.get_tracer(__name__)
meter = metrics.get_meter(__name__)

# [END opentelemetry_flask_setup_exporter]

# [START opentelemetry_flask_instrument]

app = Flask(__name__)
FlaskInstrumentor().instrument_app(app)


@app.route("/")
def hello_world():
    # You can still use the OpenTelemetry API as usual to create custom spans
    # within your trace
    with tracer.start_as_current_span("do_work"):
        time.sleep(0.1)

    return "Hello, World!"


# [END opentelemetry_flask_instrument]
Write the Client
#!/usr/bin/env python3
# Copyright 2021 The OpenTelemetry Authors
#
# Licensed under the Apache License, Version 2.0 (the "License");
# you may not use this file except in compliance with the License.
# You may obtain a copy of the License at
#
#     http://www.apache.org/licenses/LICENSE-2.0
#
# Unless required by applicable law or agreed to in writing, software
# distributed under the License is distributed on an "AS IS" BASIS,
# WITHOUT WARRANTIES OR CONDITIONS OF ANY KIND, either express or implied.
# See the License for the specific language governing permissions and
# limitations under the License.

import requests
from opentelemetry import metrics, trace
from opentelemetry.exporter.cloud_monitoring import (
    CloudMonitoringMetricsExporter,
)
from opentelemetry.exporter.cloud_trace import CloudTraceSpanExporter
from opentelemetry.instrumentation.requests import RequestsInstrumentor
from opentelemetry.propagate import set_global_textmap
from opentelemetry.propagators.cloud_trace_propagator import (
    CloudTraceFormatPropagator,
)
from opentelemetry.sdk.metrics import MeterProvider
from opentelemetry.sdk.metrics.export import PeriodicExportingMetricReader
from opentelemetry.sdk.resources import Resource
from opentelemetry.sdk.trace import TracerProvider
from opentelemetry.sdk.trace.export import BatchSpanProcessor

set_global_textmap(CloudTraceFormatPropagator())

resource = Resource.create(
    {
        "service.name": "flask_e2e_client",
        "service.namespace": "examples",
        "service.instance.id": "instance554",
    }
)

tracer_provider = TracerProvider()
cloud_trace_exporter = CloudTraceSpanExporter()
tracer_provider.add_span_processor(
    # BatchSpanProcessor buffers spans and sends them in batches in a
    # background thread. The default parameters are sensible, but can be
    # tweaked to optimize your performance
    BatchSpanProcessor(cloud_trace_exporter)
)

meter_provider = MeterProvider(
    metric_readers=[
        PeriodicExportingMetricReader(
            CloudMonitoringMetricsExporter(), export_interval_millis=5000
        )
    ],
    resource=resource,
)

trace.set_tracer_provider(tracer_provider)
metrics.set_meter_provider(meter_provider)

tracer = trace.get_tracer(__name__)
meter = metrics.get_meter(__name__)

RequestsInstrumentor().instrument()

res = requests.get("http://localhost:6000")
print(res.text)
Run
In one terminal, start the flask app:
FLASK_APP=server.py flask run -p 6000
In another terminal, run the client:
python client.py
Checking Output
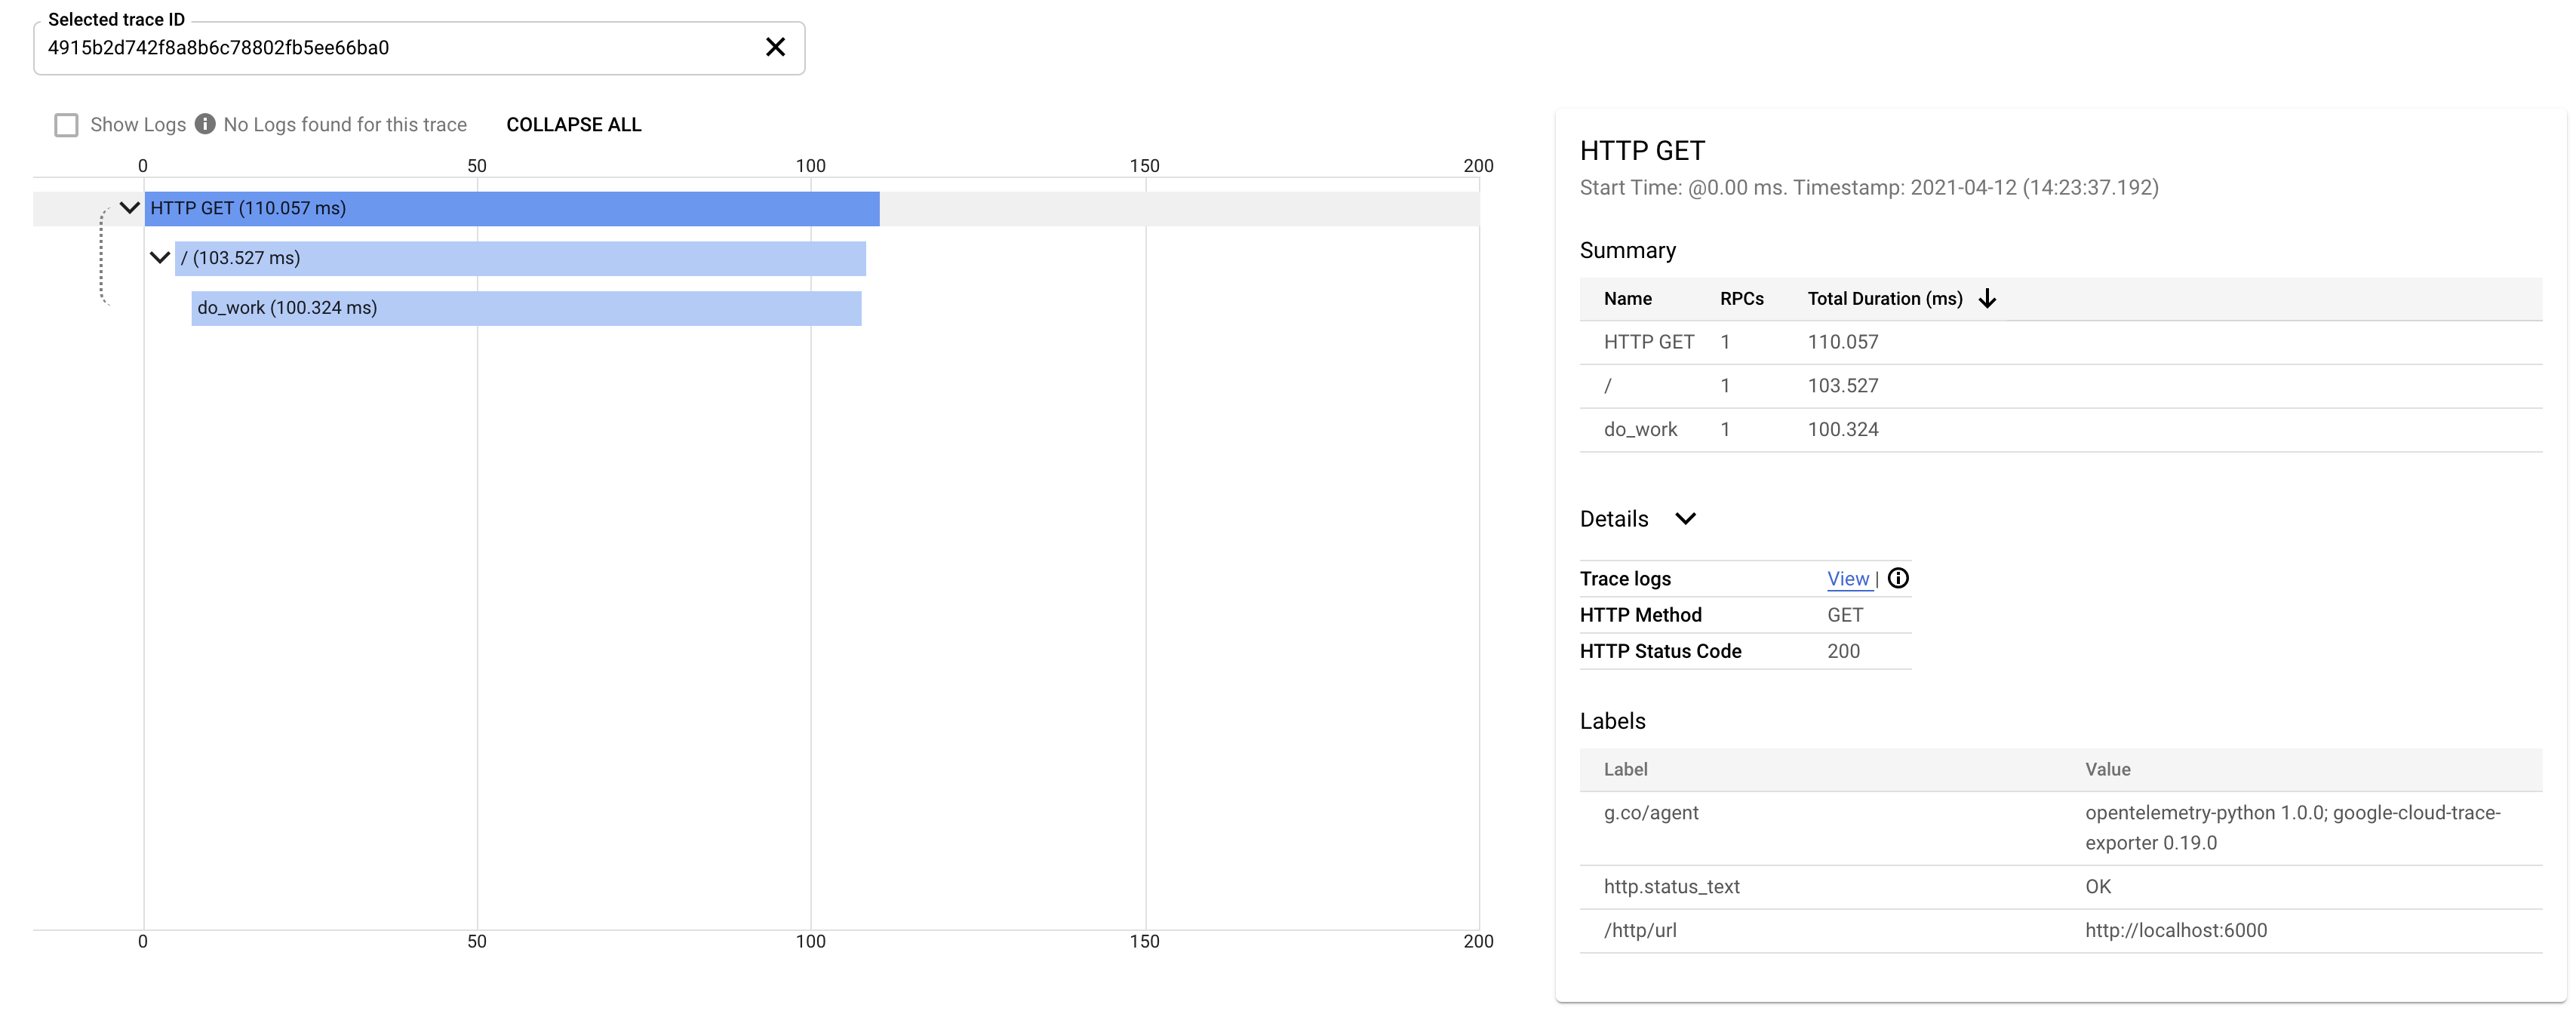
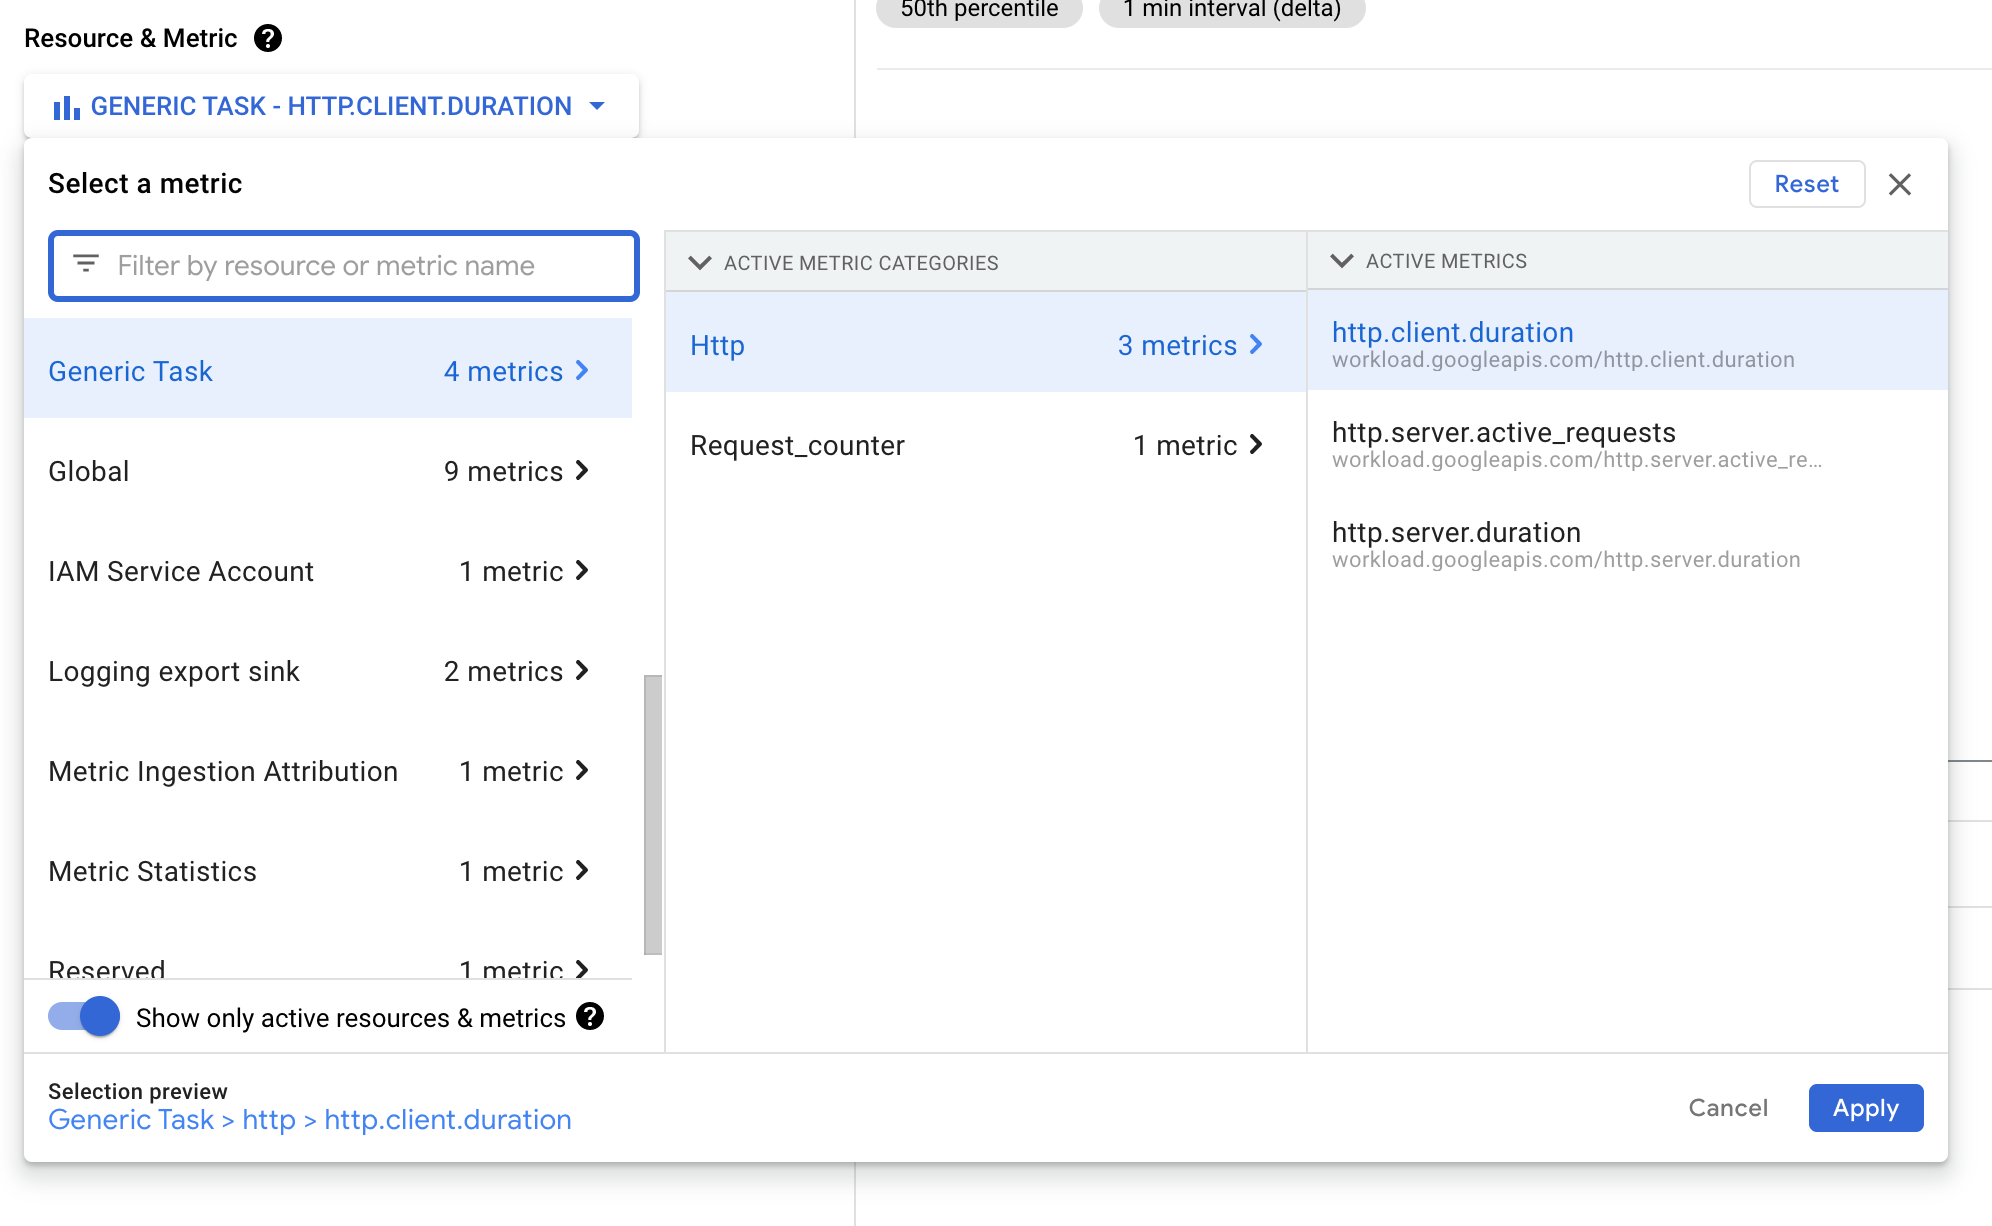
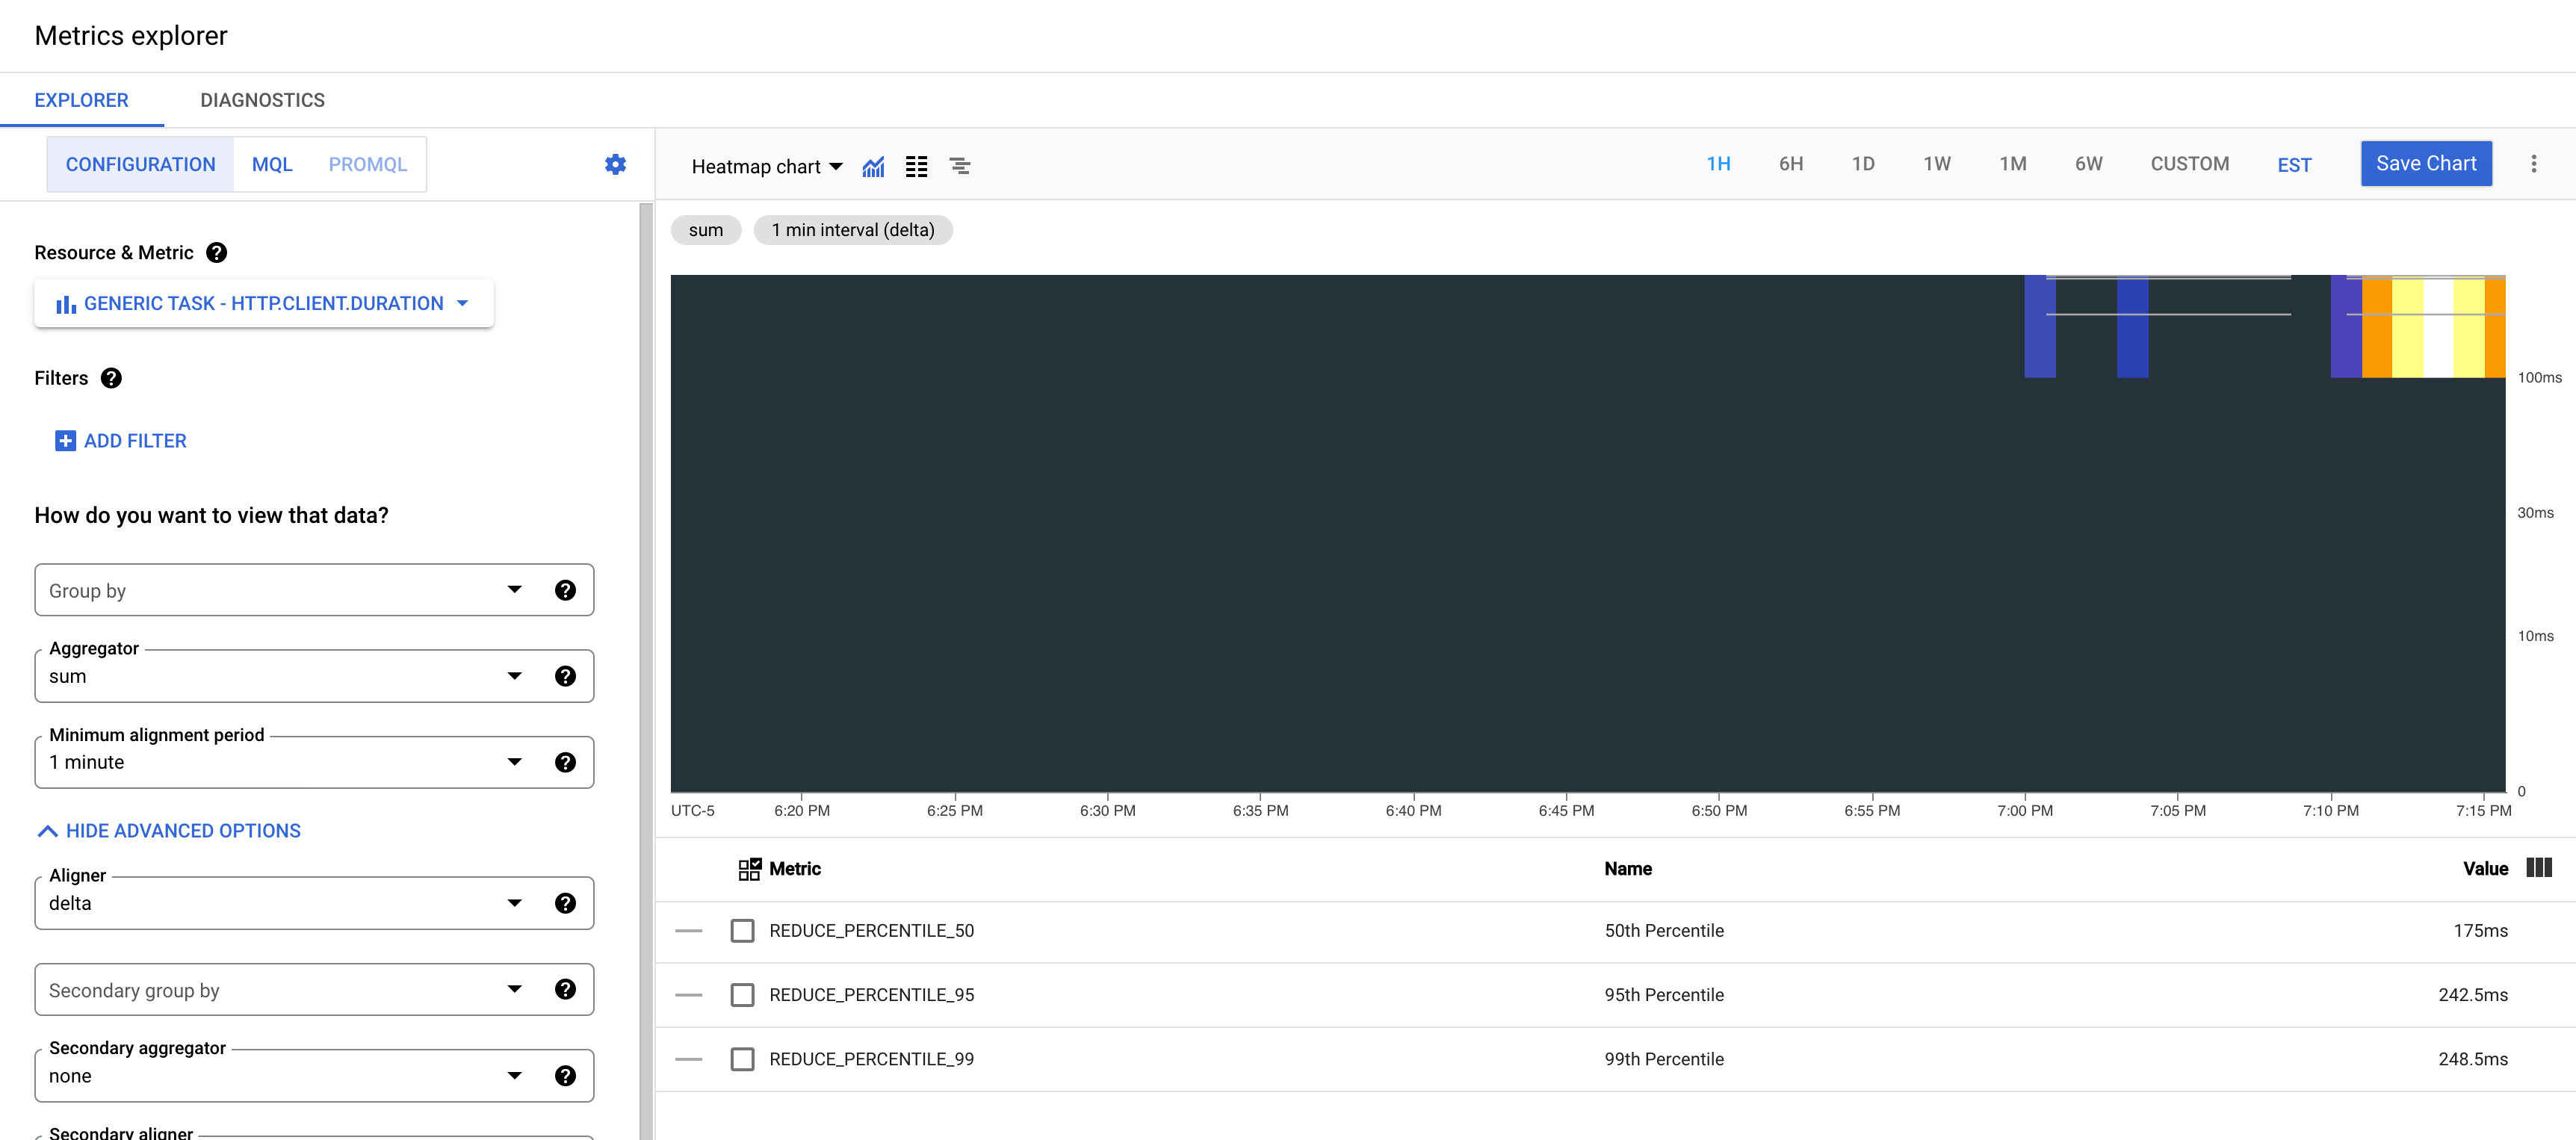
After running any of these examples, you can go to Cloud Trace overview and Cloud Monitoring Metrics Explorer page to see the results. You should
see something like the image below with a root span covering the whole client request and a
child span covering the Flask server processing the request. For metrics, you should see
various metrics created for monitored resource generic_task with “category” Http e.g.
workload.googleapis.com/http.server.duration. Client side metrics should be populated as
well e.g. workload.googleapis.com/http.client.duration.
Further Reading
Troubleshooting
google.api_core.exceptions.Aborted: 409 [...] error: Too many concurrent edits to the project configuration. Please try again.
This is a transient error when a metric is first written to Cloud Monitoring. Try again and things should work fine.